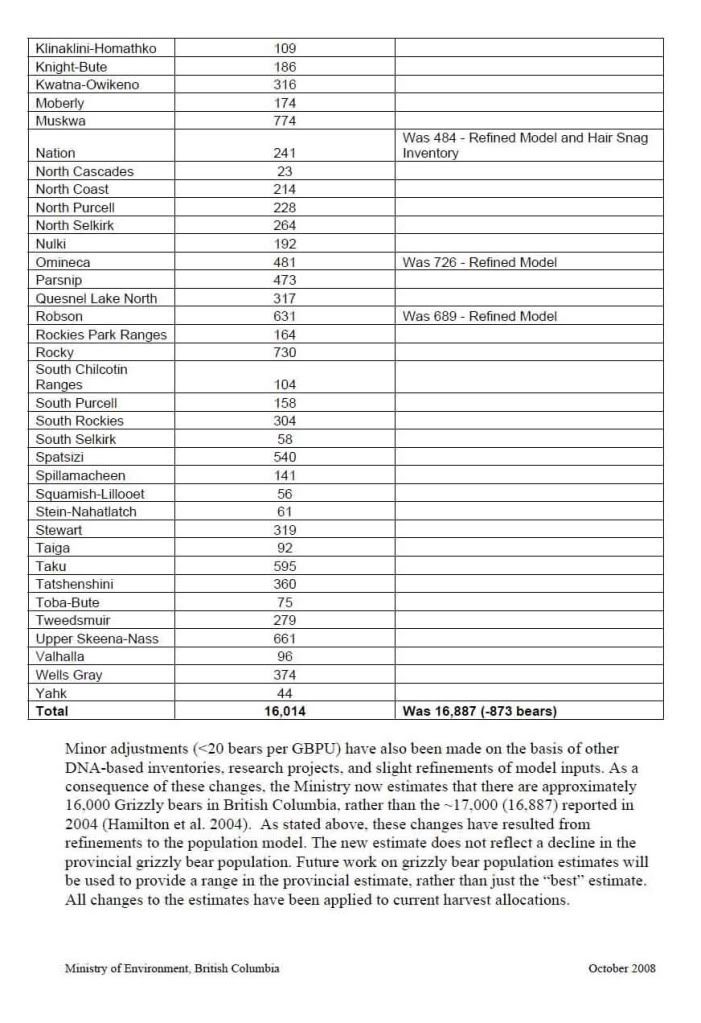
Post by grrraaahhh on Jan 28, 2012 19:11:30 GMT -9
Text Extract
Density. For brown/grizzly bears, like most species, density (number/ unit area) is a key population parameter. High-density bear populations can exist in areas with abundant and uniformly distributed food resources. Low-density bear populations exist in areas where food resources are sparse and/or patchy with long distances between patches (or where there has been excessive human killing of bears). The highest documented grizzly bear density in North America is about 140 times greater than in low-density areas (Table 26.9).
The greatest brown bear densities in North America occur in coastal areas of Alaska, where bears thrive on summer and fall runs of salmon. Coastal maritime climate leads to longer growing seasons, which also benefit bears. Documented densities in these areas are 175-550 bears (all ages)/l000 km2 (Miller et al. 1997) (Table 26.9). Salmon import energy from rich marine systems into frequently nutrient-impoverished terrestrial systems. Because of this importation of energy, bears living in salmon-rich areas not only have more dense populations, but they are 1.5-3 times larger in body mass (Glenn 1980; Hilderbrand et al. 1999a). Populations with the lowest densities occur in the extreme northern part of North America, between the Alaska Range and the Beaufort Sea in Alaska, and in northern Yukon and Northwest Territories in Canada (Kingsley et al. 1988). Densities in these areas are typically <l0 bears/1000 krn2 (Table 26.9). Higher densities can be maintained even in these northern environments in areas where caribou are abundant (Reynolds and Garner 1987). Migratory caribou, like anadrornous salmon, are net importers of energy into these energetically impoverished northern systems. Nutrients from salmon that are imported into forest ecosystems and distributed as bear feces may be important for forests growing as far inland as Idaho (Hilderbrand et al. 1999b).
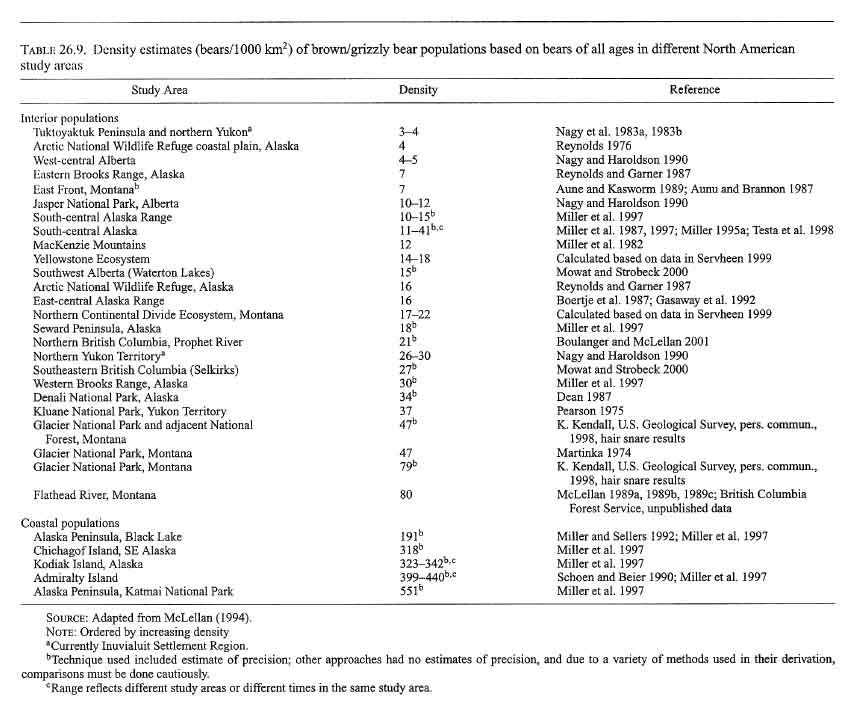
Techniques for estimating bear density are not standardized; consequently, density estimates presented in Table 26.9 are not directly comparable. In Alaska, however, 19 brown bear density estimates were obtained using the same techniques in different habitats; all are directly comparable and have measures of precision (Miller 1995b; Miller et al. 1997; Testa et al. 1998). These techniques required the use of radio collars, which largely eliminate the problem of geographic closure common to other density estimation techniques.
Radio-marking techniques are not broadly applied outside of Alaska because of expense, need to capture bears to apply radio collars, and low sight ability of bears in heavily forested habitats. Instead, many researchers in Canada and the United States have focused on the development of techniques to estimate number of bears and density employing hair-snaring methods. With this procedure, bears are attracted to sampling stations with a scent lure. At each sampling station, barbed wire is strung between trees, and when the bear passes under the wire, a small tuft of hair is snagged in the barb of the wire (Woods et al. 1996, 1999). The follicles from these hair samples contain DNA, which can be used to identify individual animals. This technique is conceptually similar to techniques developed to identify bears based on photos taken when bears trip cameras (Mace et al. 1994). Advantages of these DNA and camera techniques include reduced need to mark bears or see them from aircraft. However, these techniques are labor intensive and expensive, and typically have problems identifying the area inhabited by the estimated population. This closure problem creates difficulties in estimating density. So far, the DNA and camera techniques are not standardized for design or data analysis, hence results from different areas may not be comparable. In Glacier National Park, U.S. Geological Survey researcher Kate Kendall has conducted the most extensive effort to estimate grizzly bear abundance using hair-snaring and British Columbia and Montana. The A value for the GYE was 0.97-1.12 (Eberhardt 1995). Stable population growth was estimated for grizzlies in the Kananaskis area of southwestern Alberta (A=0.99-1.01; Wielgus and Bunnell 1994) and the Selkirk Mountains of British Columbia and Idaho (A = 1.00; Wielgus et al. 1994). A declining population was estimated for the Swan Mountains of Montana (A = 0.977, 95% confidence interval [CI] = 0.875--1.046; Mace and Waller 1998). Some of these rates are point estimates based on small sample sizes. For nearly all estimates, the 95% CI bounds 1.0, making it impossible to determine true population trajectory. For a slowly reproducing species like grizzly bears, in which even a maximum lambda will always be close to 1.0, it will seldom be possible to have a 95% CI that does not overlap 1.0. Uncertainty primarily associated with subadult and adult female survival explains most of the variance associated with these estimates (Eberhardt et al. 1994; Hovey and McLellan 1996; Mace and Waller 1998).
Shaffer (1978, 1983) was the first to use stochastic models to help guide grizzly bear management in Yellowstone National Park. This pioneering work was the first PYA for any species. His model estimated a minimum viable population, or the smallest population size necessary with a 95% chance of remaining extant after 100 years. Initial simulations indicated that a population of 35 grizzly bears might be expected to survive 100 years. Because of uncertainty associated with his original estimate, Shaffer (1983) later suggested that this value should be increased to 50-90 bears. Later Suchy et al. (1985) updated these estimates to 40-125 or 50-225 bears depending on a low versus high mortality schedule. To be conservative, Suchy et al. (1985) recommended a population >125 be maintained to ensure a high probability of persistence for at least 100 years. Soule (1987) and Shaffer (1992) expressed concern that targeting a minimum population level is inadequate for sound conservation and that larger populations are necessary to ensure long-term persistence of the species. More recent reviews of PYA (Boyce 1992; Boyce et al. 200 I) have pointed out that traditional PYA models are demographically based; they lack a link to habitat, particularly habitat changes. Most PYAs do not consider genetic effects, including inbreeding depression, loss of evolutionary potential, and accumulation of harmful mutations (Allendorf and Ryman 2002).
Source: Schwartz, C.c., S.D. Miller, and M.A. Haroldson. 2003. Grizzly bear. Pages 556-586 in G.A. Feldhamer, B.C. Thompson, and J.A. Chapman, editors. Wild Mammals ofNorth America: Biology, Management, and Conservation. Second edition. The Johns Hopkins University Press, Baltimore, Maryland, USA.
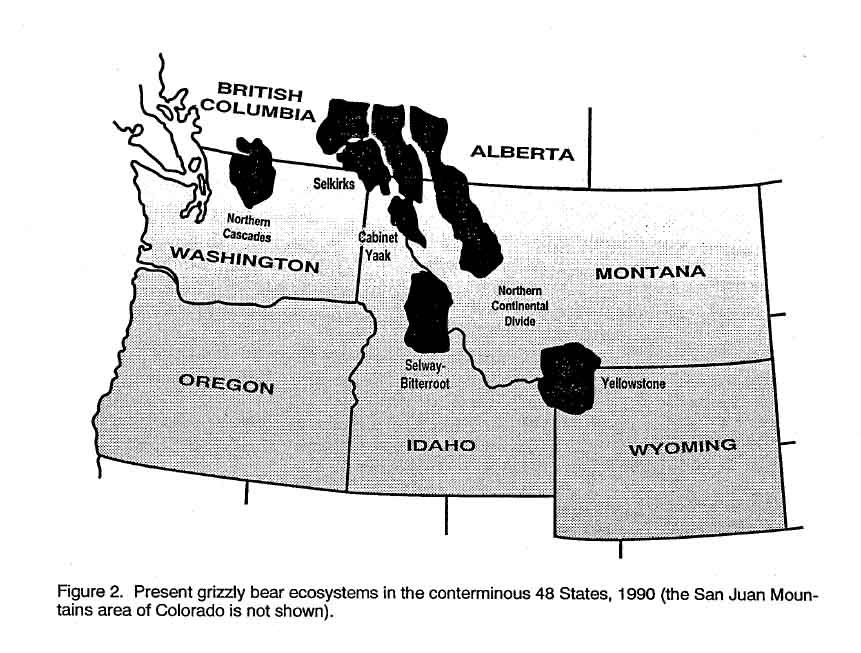
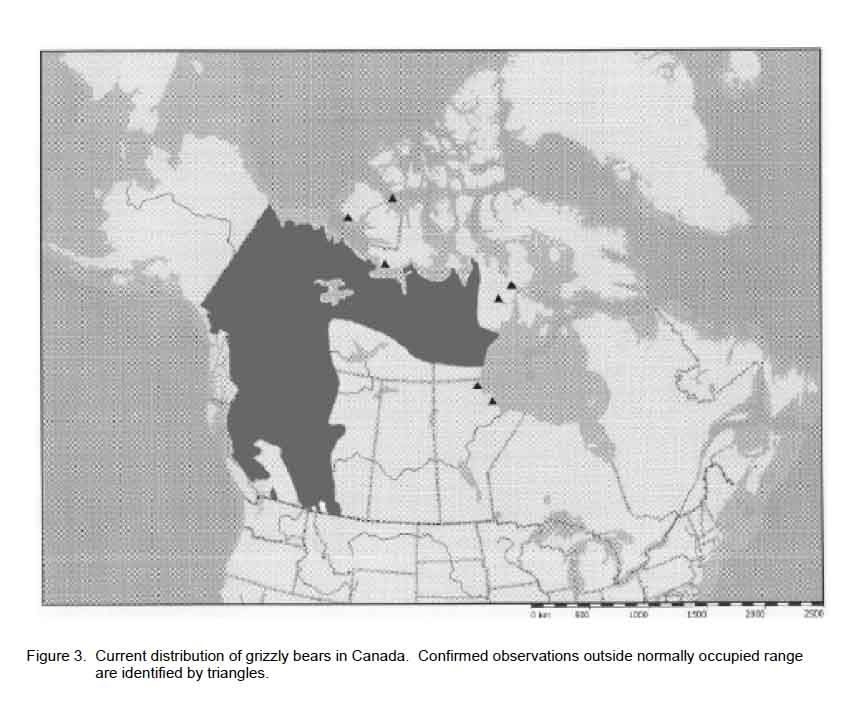
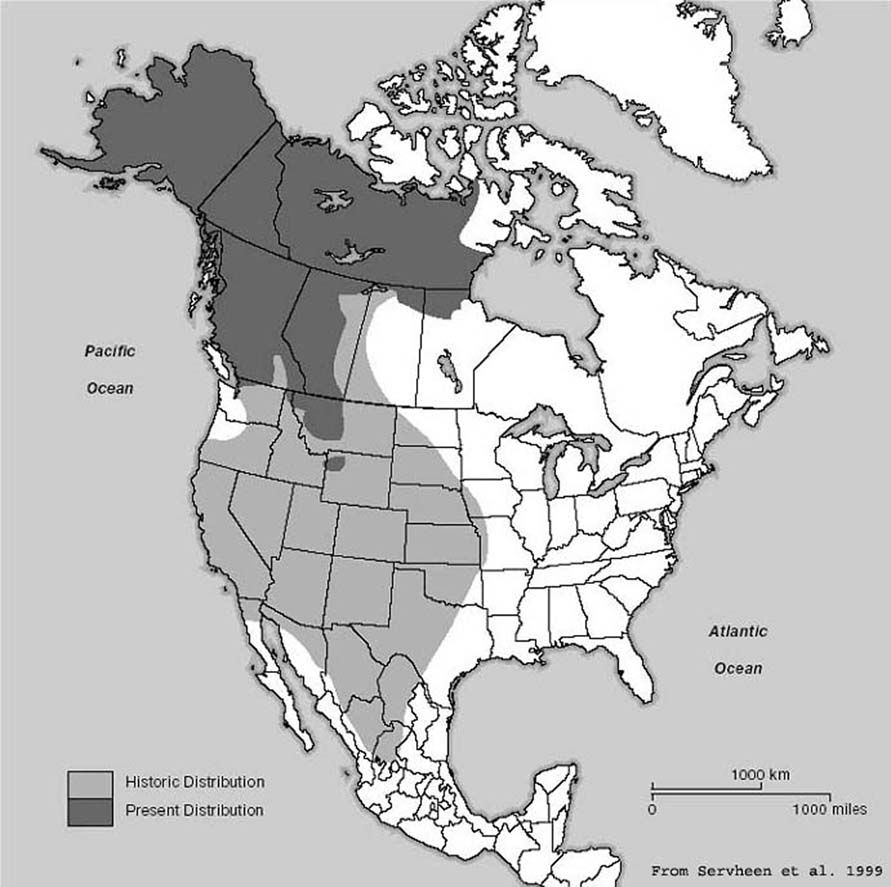
Historical and current distribution range of Ursus arctos in North America.
Focus: United States, Alaska
Research and conservation: Alaska has over 98 percent of the United States population of brown bears, and more than 70 percent of the North American population, so it has a special responsibility to this magnificent animal.
Source: ADF&G PDF LINK
Text Extract: Distribution and density of brown bears in Alaska
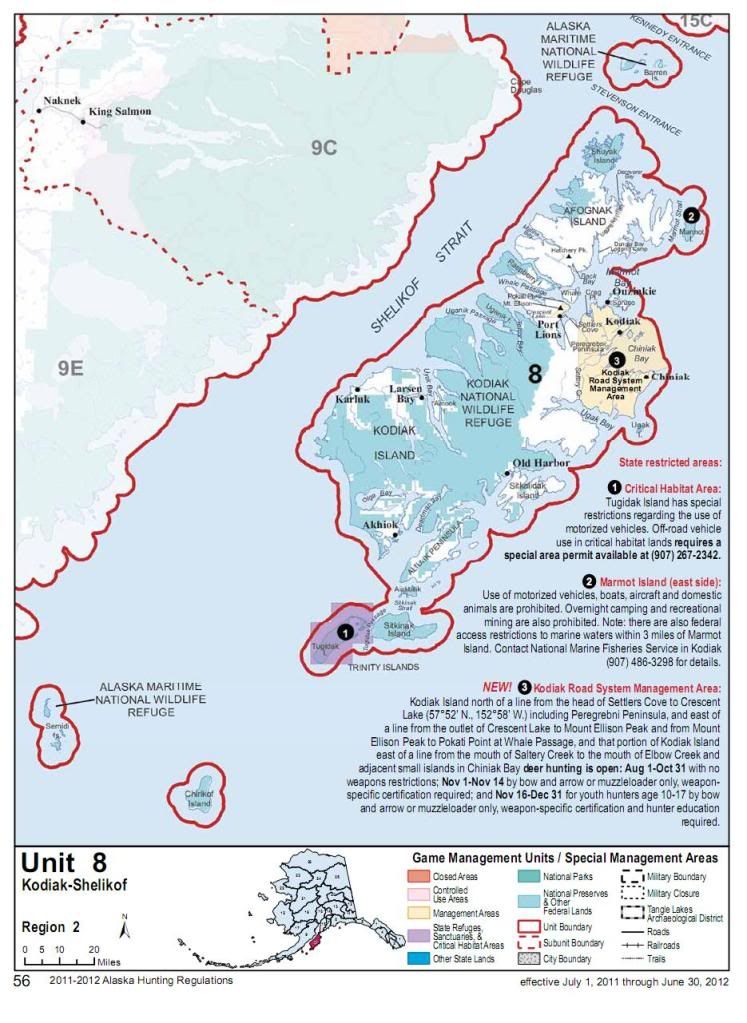
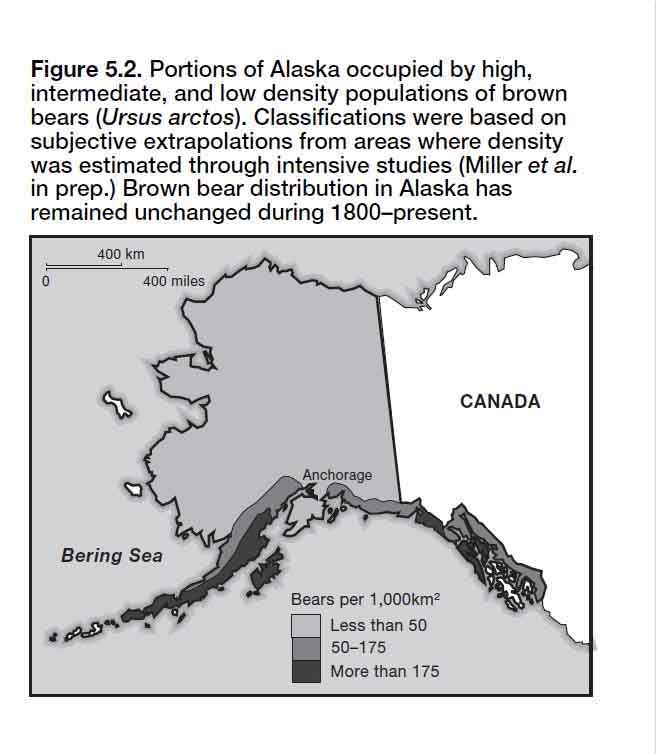
Most of Alaska from sea level to approximately 1,500m elevation is occupied brown bear habitat (Figure 5.2). The subspecies horribilis occurs from Unimak Island, on the of the Alaska Peninsula, Kodiak and Afognak Islands, and the northern islands of southeastern Alaska (Figure 5.2) (Miller et al. in prep.). Approximately 50% of Alaska’s brown bear population occurs in these high density populations which represents about 8.5% of the brown bear habitat in the state (Figure 5.2). It appears likely that these high densities are supported in large part by abundant runs of up to five species of Pacific salmon (Oncorhynchus spp.) and lush plant and fruit resources found in these warmer maritime environments. Bears in these high density portions of the Alaskan coast are larger and generally darker than bears from interior and arctic regions of Alaska. These size and color differences have resulted in coastal bears being commonly called “brown” bears while the smaller and usually lighter-colored interior bears are called “grizzlies”.
Densities less than 40 bears/1,000km2 have been reliably estimated in the portions of interior Alaska without access to abundant salmon runs (Figure 5.2) (Miller et al. in prep.). These estimates range from 6.8/1,000km2 on the coastal flatlands and adjacent foothills of the northeastern Brooks Range (Reynolds and Garner 1987) to 34 bears/ 1,000km2 in Denali National Park (Dean 1987). These low density habitats represent about 84% of the brown bear’s distribution in Alaska (Figure 5.2). Approximately 41% of Alaska’s brown bear population lives in these low density habitats.
Intermediate densities of 40–175 bears/1,000km2 are thought to occur in small areas of south-central Alaska near the coast and on the mainland in southeastern Alaska. These areas represent approximately 7.5% of Alaska’s bear habitat and contain about 9% of the population (Figure 5.2). The classification of these areas as intermediate in density is based on subjective impressions; bear densities have not been directly measured in any of these areas.
There is no precise estimate on the number of brown bears in Alaska. During the period 1985–1992, however, information on brown bear density was estimated in 15 Alaskan study areas using standardized capture-mark recapture techniques (Miller et al. in press). Density estimates using other techniques were available in four other areas (Miller et al. in press). In 1993, biologists from the Alaska Department of Fish and Game were asked to make subjective extrapolations from these density estimates to obtain population estimates for each of the 26 game management units in Alaska (Miller 1993). Biologists were also asked to subjectively estimate minimum and maximum numbers for their areas based on the reference density values. This resulted in an estimate of 31,700 bears in Alaska with a lower limit of 25,000 and an upper limit of 39,100 (Miller 1993). This estimate is lower than previous estimates for Alaska (Peek et al. 1987) not because bear populations have declined, but because of improved information on bear densities.
Source: Miller, S. D., and J. Schoen. 1999. Status and management of the brown bear in Alaska. Pages 40--46 in C. Servheen, S. Herrero, and B. Peyton, comps. Bears: Status survey and conservation action Plan. lUCN/SSC Bear and Polar Bear Specialist Groups, lUCN, Gland, Switzerland, and Cambridge, UK.
To be continued......
Density. For brown/grizzly bears, like most species, density (number/ unit area) is a key population parameter. High-density bear populations can exist in areas with abundant and uniformly distributed food resources. Low-density bear populations exist in areas where food resources are sparse and/or patchy with long distances between patches (or where there has been excessive human killing of bears). The highest documented grizzly bear density in North America is about 140 times greater than in low-density areas (Table 26.9).
The greatest brown bear densities in North America occur in coastal areas of Alaska, where bears thrive on summer and fall runs of salmon. Coastal maritime climate leads to longer growing seasons, which also benefit bears. Documented densities in these areas are 175-550 bears (all ages)/l000 km2 (Miller et al. 1997) (Table 26.9). Salmon import energy from rich marine systems into frequently nutrient-impoverished terrestrial systems. Because of this importation of energy, bears living in salmon-rich areas not only have more dense populations, but they are 1.5-3 times larger in body mass (Glenn 1980; Hilderbrand et al. 1999a). Populations with the lowest densities occur in the extreme northern part of North America, between the Alaska Range and the Beaufort Sea in Alaska, and in northern Yukon and Northwest Territories in Canada (Kingsley et al. 1988). Densities in these areas are typically <l0 bears/1000 krn2 (Table 26.9). Higher densities can be maintained even in these northern environments in areas where caribou are abundant (Reynolds and Garner 1987). Migratory caribou, like anadrornous salmon, are net importers of energy into these energetically impoverished northern systems. Nutrients from salmon that are imported into forest ecosystems and distributed as bear feces may be important for forests growing as far inland as Idaho (Hilderbrand et al. 1999b).

Techniques for estimating bear density are not standardized; consequently, density estimates presented in Table 26.9 are not directly comparable. In Alaska, however, 19 brown bear density estimates were obtained using the same techniques in different habitats; all are directly comparable and have measures of precision (Miller 1995b; Miller et al. 1997; Testa et al. 1998). These techniques required the use of radio collars, which largely eliminate the problem of geographic closure common to other density estimation techniques.
Radio-marking techniques are not broadly applied outside of Alaska because of expense, need to capture bears to apply radio collars, and low sight ability of bears in heavily forested habitats. Instead, many researchers in Canada and the United States have focused on the development of techniques to estimate number of bears and density employing hair-snaring methods. With this procedure, bears are attracted to sampling stations with a scent lure. At each sampling station, barbed wire is strung between trees, and when the bear passes under the wire, a small tuft of hair is snagged in the barb of the wire (Woods et al. 1996, 1999). The follicles from these hair samples contain DNA, which can be used to identify individual animals. This technique is conceptually similar to techniques developed to identify bears based on photos taken when bears trip cameras (Mace et al. 1994). Advantages of these DNA and camera techniques include reduced need to mark bears or see them from aircraft. However, these techniques are labor intensive and expensive, and typically have problems identifying the area inhabited by the estimated population. This closure problem creates difficulties in estimating density. So far, the DNA and camera techniques are not standardized for design or data analysis, hence results from different areas may not be comparable. In Glacier National Park, U.S. Geological Survey researcher Kate Kendall has conducted the most extensive effort to estimate grizzly bear abundance using hair-snaring and British Columbia and Montana. The A value for the GYE was 0.97-1.12 (Eberhardt 1995). Stable population growth was estimated for grizzlies in the Kananaskis area of southwestern Alberta (A=0.99-1.01; Wielgus and Bunnell 1994) and the Selkirk Mountains of British Columbia and Idaho (A = 1.00; Wielgus et al. 1994). A declining population was estimated for the Swan Mountains of Montana (A = 0.977, 95% confidence interval [CI] = 0.875--1.046; Mace and Waller 1998). Some of these rates are point estimates based on small sample sizes. For nearly all estimates, the 95% CI bounds 1.0, making it impossible to determine true population trajectory. For a slowly reproducing species like grizzly bears, in which even a maximum lambda will always be close to 1.0, it will seldom be possible to have a 95% CI that does not overlap 1.0. Uncertainty primarily associated with subadult and adult female survival explains most of the variance associated with these estimates (Eberhardt et al. 1994; Hovey and McLellan 1996; Mace and Waller 1998).
Shaffer (1978, 1983) was the first to use stochastic models to help guide grizzly bear management in Yellowstone National Park. This pioneering work was the first PYA for any species. His model estimated a minimum viable population, or the smallest population size necessary with a 95% chance of remaining extant after 100 years. Initial simulations indicated that a population of 35 grizzly bears might be expected to survive 100 years. Because of uncertainty associated with his original estimate, Shaffer (1983) later suggested that this value should be increased to 50-90 bears. Later Suchy et al. (1985) updated these estimates to 40-125 or 50-225 bears depending on a low versus high mortality schedule. To be conservative, Suchy et al. (1985) recommended a population >125 be maintained to ensure a high probability of persistence for at least 100 years. Soule (1987) and Shaffer (1992) expressed concern that targeting a minimum population level is inadequate for sound conservation and that larger populations are necessary to ensure long-term persistence of the species. More recent reviews of PYA (Boyce 1992; Boyce et al. 200 I) have pointed out that traditional PYA models are demographically based; they lack a link to habitat, particularly habitat changes. Most PYAs do not consider genetic effects, including inbreeding depression, loss of evolutionary potential, and accumulation of harmful mutations (Allendorf and Ryman 2002).
Source: Schwartz, C.c., S.D. Miller, and M.A. Haroldson. 2003. Grizzly bear. Pages 556-586 in G.A. Feldhamer, B.C. Thompson, and J.A. Chapman, editors. Wild Mammals ofNorth America: Biology, Management, and Conservation. Second edition. The Johns Hopkins University Press, Baltimore, Maryland, USA.
Historical and current distribution range of Ursus arctos in North America.

Focus: United States, Alaska
Research and conservation: Alaska has over 98 percent of the United States population of brown bears, and more than 70 percent of the North American population, so it has a special responsibility to this magnificent animal.
Source: ADF&G PDF LINK
Text Extract: Distribution and density of brown bears in Alaska
Most of Alaska from sea level to approximately 1,500m elevation is occupied brown bear habitat (Figure 5.2). The subspecies horribilis occurs from Unimak Island, on the of the Alaska Peninsula, Kodiak and Afognak Islands, and the northern islands of southeastern Alaska (Figure 5.2) (Miller et al. in prep.). Approximately 50% of Alaska’s brown bear population occurs in these high density populations which represents about 8.5% of the brown bear habitat in the state (Figure 5.2). It appears likely that these high densities are supported in large part by abundant runs of up to five species of Pacific salmon (Oncorhynchus spp.) and lush plant and fruit resources found in these warmer maritime environments. Bears in these high density portions of the Alaskan coast are larger and generally darker than bears from interior and arctic regions of Alaska. These size and color differences have resulted in coastal bears being commonly called “brown” bears while the smaller and usually lighter-colored interior bears are called “grizzlies”.
Densities less than 40 bears/1,000km2 have been reliably estimated in the portions of interior Alaska without access to abundant salmon runs (Figure 5.2) (Miller et al. in prep.). These estimates range from 6.8/1,000km2 on the coastal flatlands and adjacent foothills of the northeastern Brooks Range (Reynolds and Garner 1987) to 34 bears/ 1,000km2 in Denali National Park (Dean 1987). These low density habitats represent about 84% of the brown bear’s distribution in Alaska (Figure 5.2). Approximately 41% of Alaska’s brown bear population lives in these low density habitats.
Intermediate densities of 40–175 bears/1,000km2 are thought to occur in small areas of south-central Alaska near the coast and on the mainland in southeastern Alaska. These areas represent approximately 7.5% of Alaska’s bear habitat and contain about 9% of the population (Figure 5.2). The classification of these areas as intermediate in density is based on subjective impressions; bear densities have not been directly measured in any of these areas.

There is no precise estimate on the number of brown bears in Alaska. During the period 1985–1992, however, information on brown bear density was estimated in 15 Alaskan study areas using standardized capture-mark recapture techniques (Miller et al. in press). Density estimates using other techniques were available in four other areas (Miller et al. in press). In 1993, biologists from the Alaska Department of Fish and Game were asked to make subjective extrapolations from these density estimates to obtain population estimates for each of the 26 game management units in Alaska (Miller 1993). Biologists were also asked to subjectively estimate minimum and maximum numbers for their areas based on the reference density values. This resulted in an estimate of 31,700 bears in Alaska with a lower limit of 25,000 and an upper limit of 39,100 (Miller 1993). This estimate is lower than previous estimates for Alaska (Peek et al. 1987) not because bear populations have declined, but because of improved information on bear densities.
Source: Miller, S. D., and J. Schoen. 1999. Status and management of the brown bear in Alaska. Pages 40--46 in C. Servheen, S. Herrero, and B. Peyton, comps. Bears: Status survey and conservation action Plan. lUCN/SSC Bear and Polar Bear Specialist Groups, lUCN, Gland, Switzerland, and Cambridge, UK.
To be continued......

